Report design
We transform dense documents into beautifully designed, engaging reports that communicate your insights with impact.
Fill out the form below and we'll get back to you to book in a discovery call straight away.
We tell beautiful stories with your data to drive customer engagement, acquisition and growth.
Organisations produce valuable reports and research but are struggling to get it seen.
Research shows that up to 80% of PDFs published by organisations are never fully read.
(Source: Nielsen Norman Group, 2022)
Cognitive overload reduces attention and comprehension and forces readers to stop.
We design and build collateral that will make the most of your IP, driving engagement and revenue for your organisation.
We transform dense documents into beautifully designed, engaging reports that communicate your insights with impact.
We create web experiences that combine science, storytelling, and interactivity to engage audiences worldwide.
We turn complex data into clear, visually striking graphics that resonate with audiences and increase understanding.
Selected case studies from our brilliant clients.
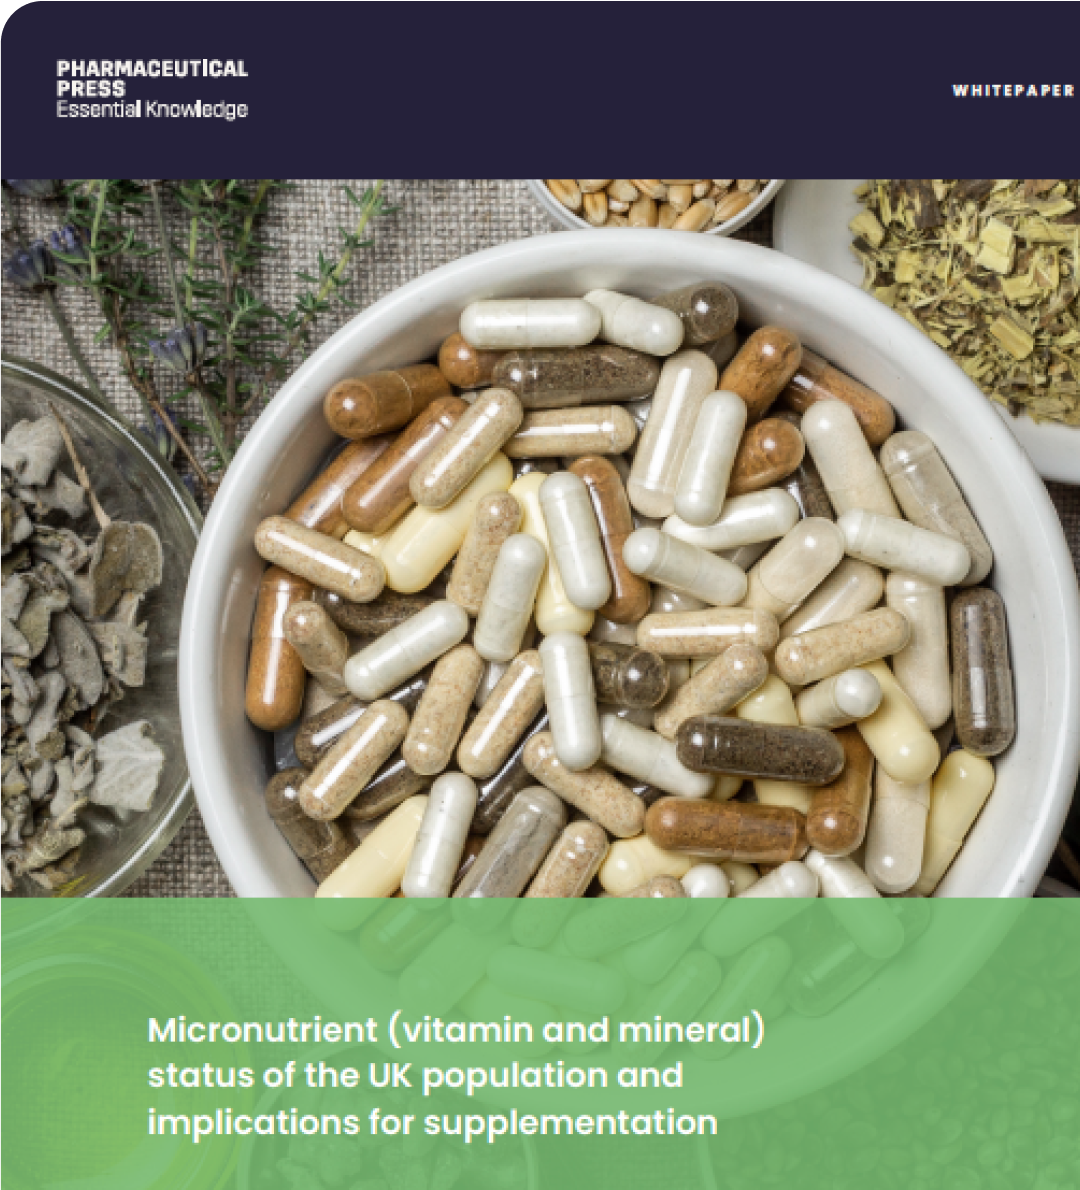
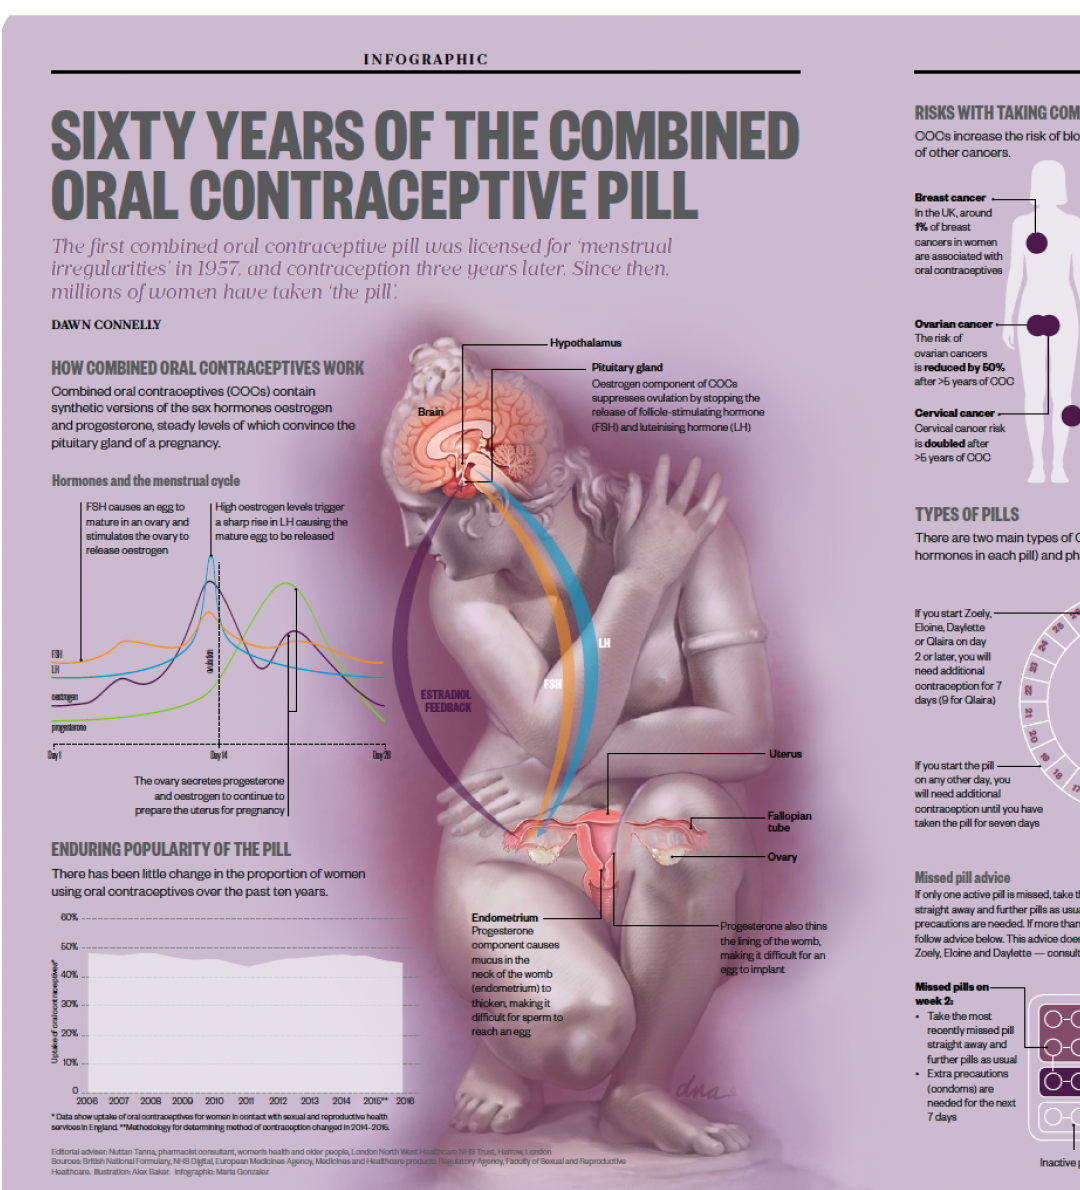
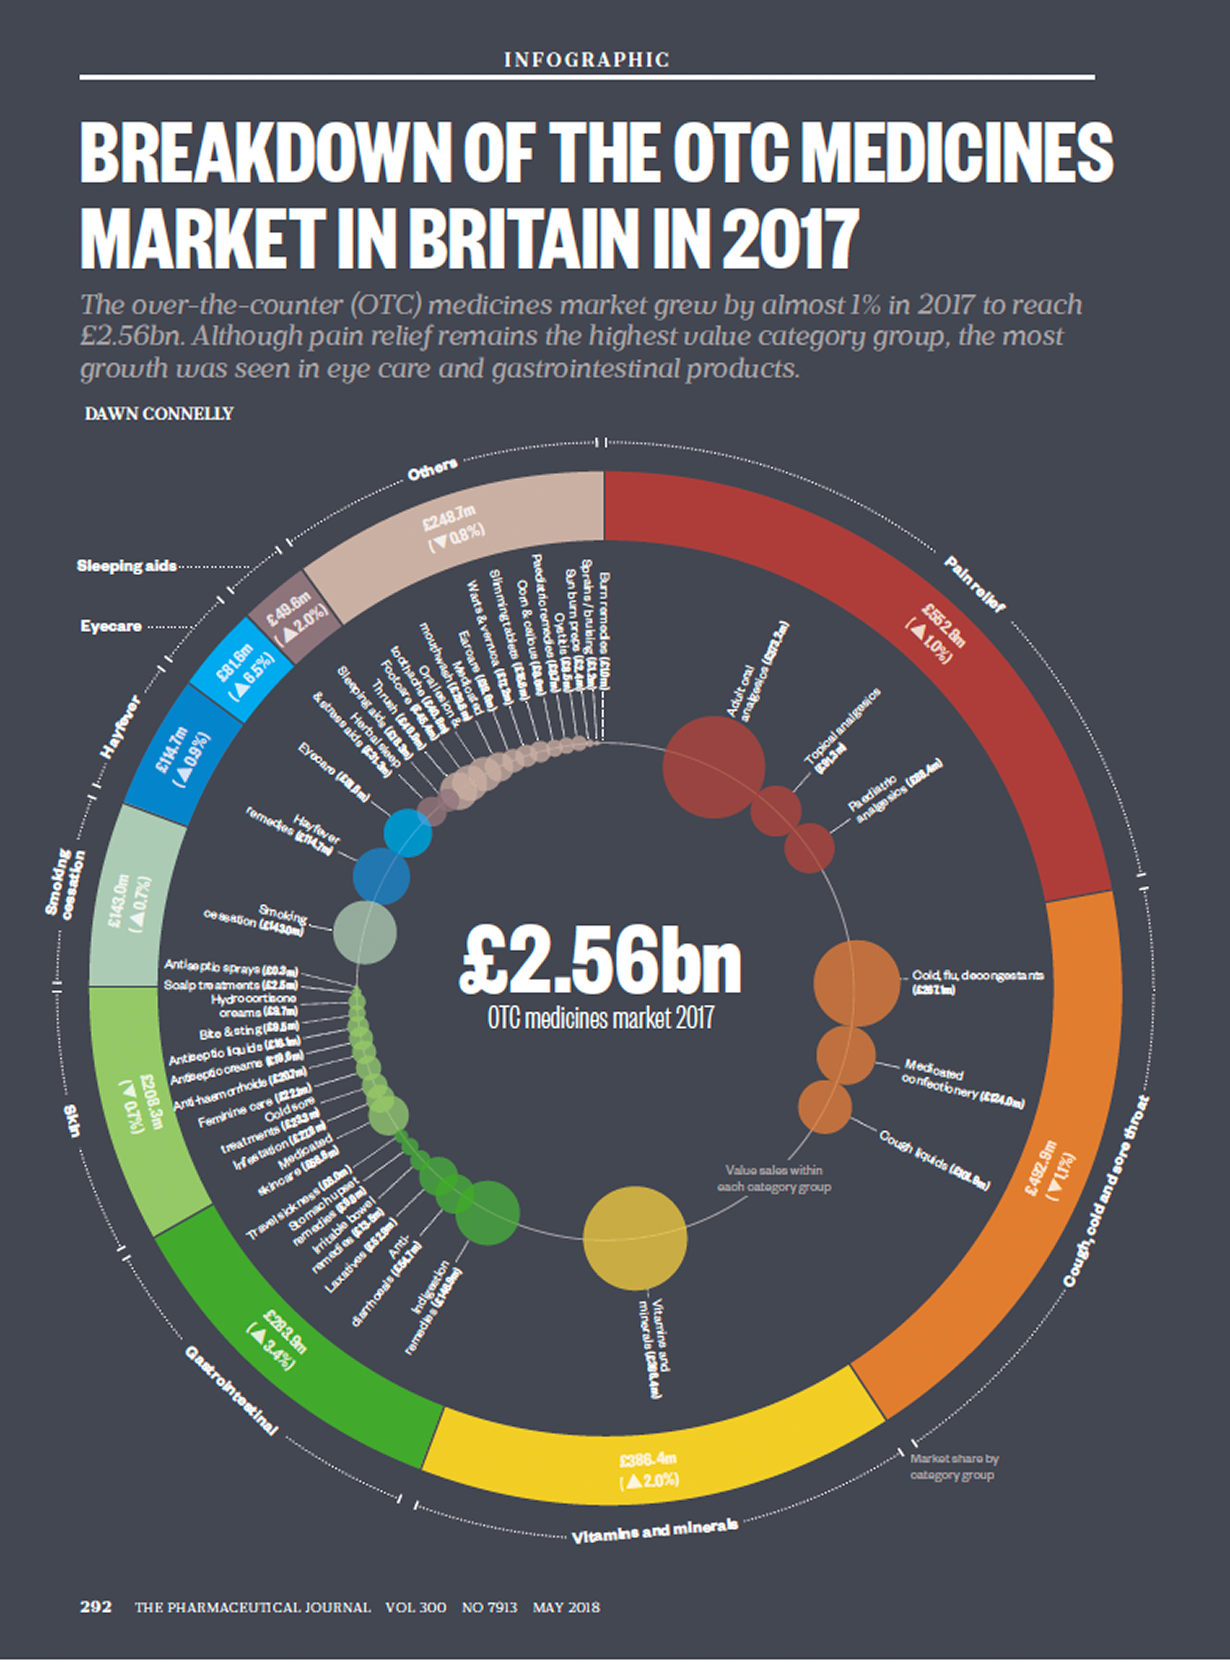
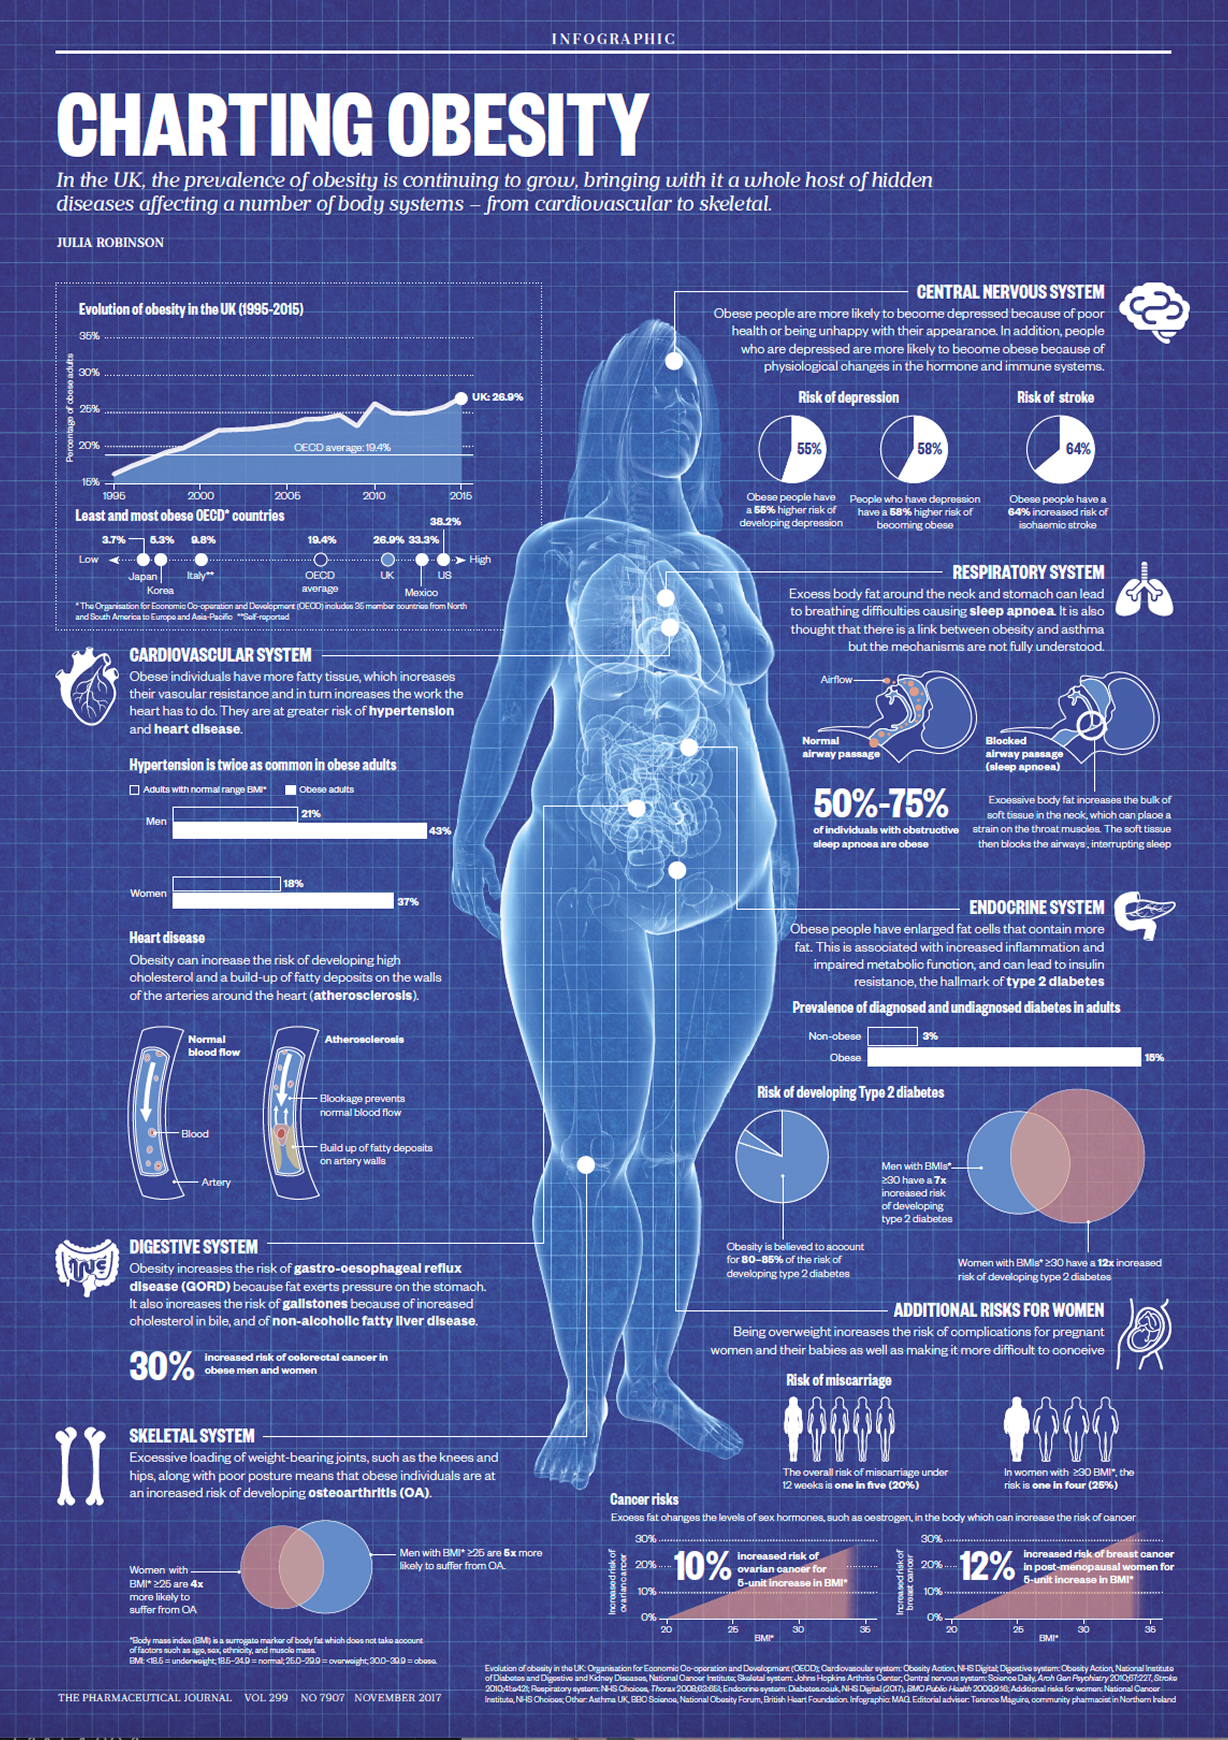
Partnering with Pharmaceutical Journal to create a series of detailed, information-rich illustrations and infographic spreads that translated complex medical data into clear, engaging visuals for their specialist audience of medical students and professionals.

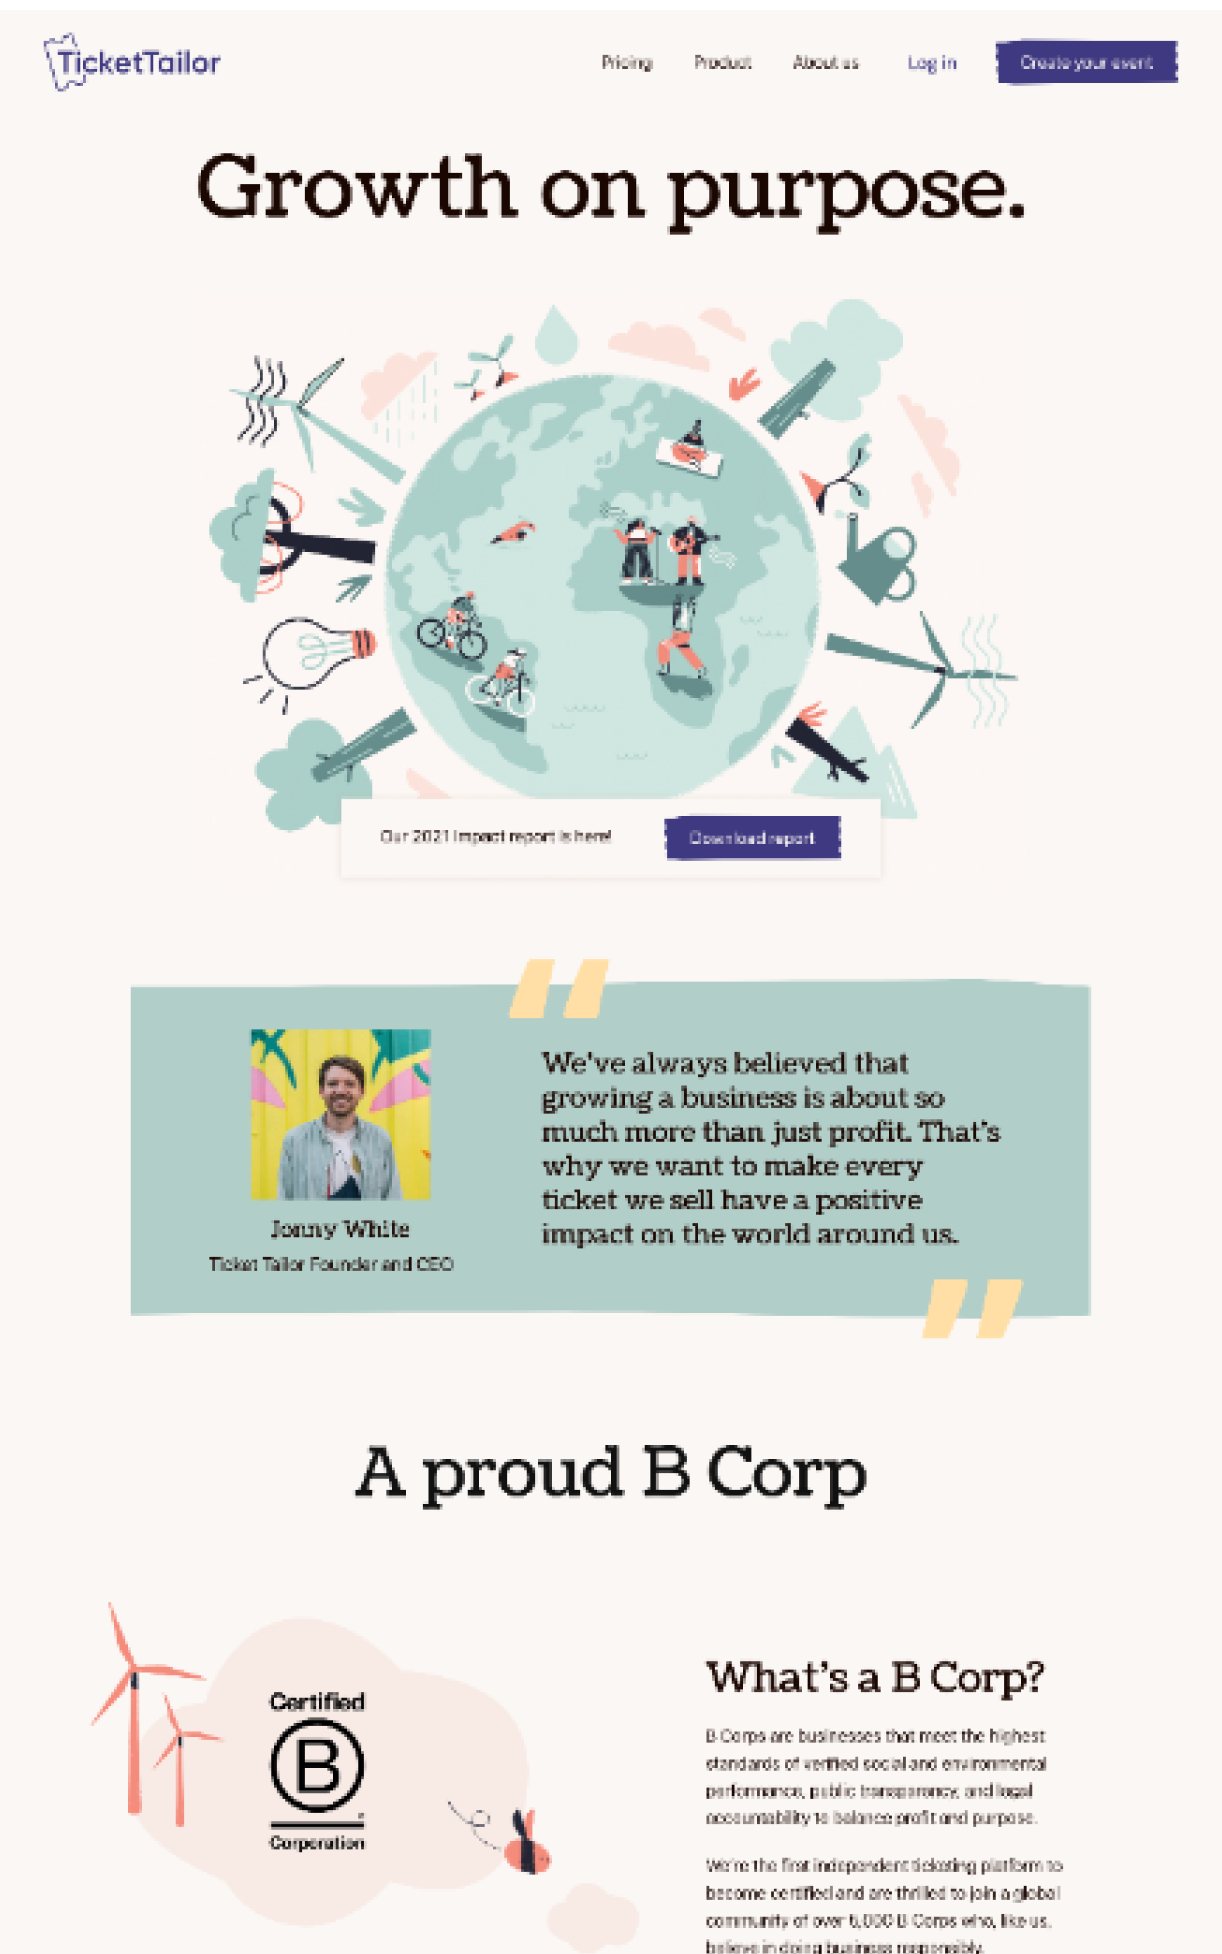
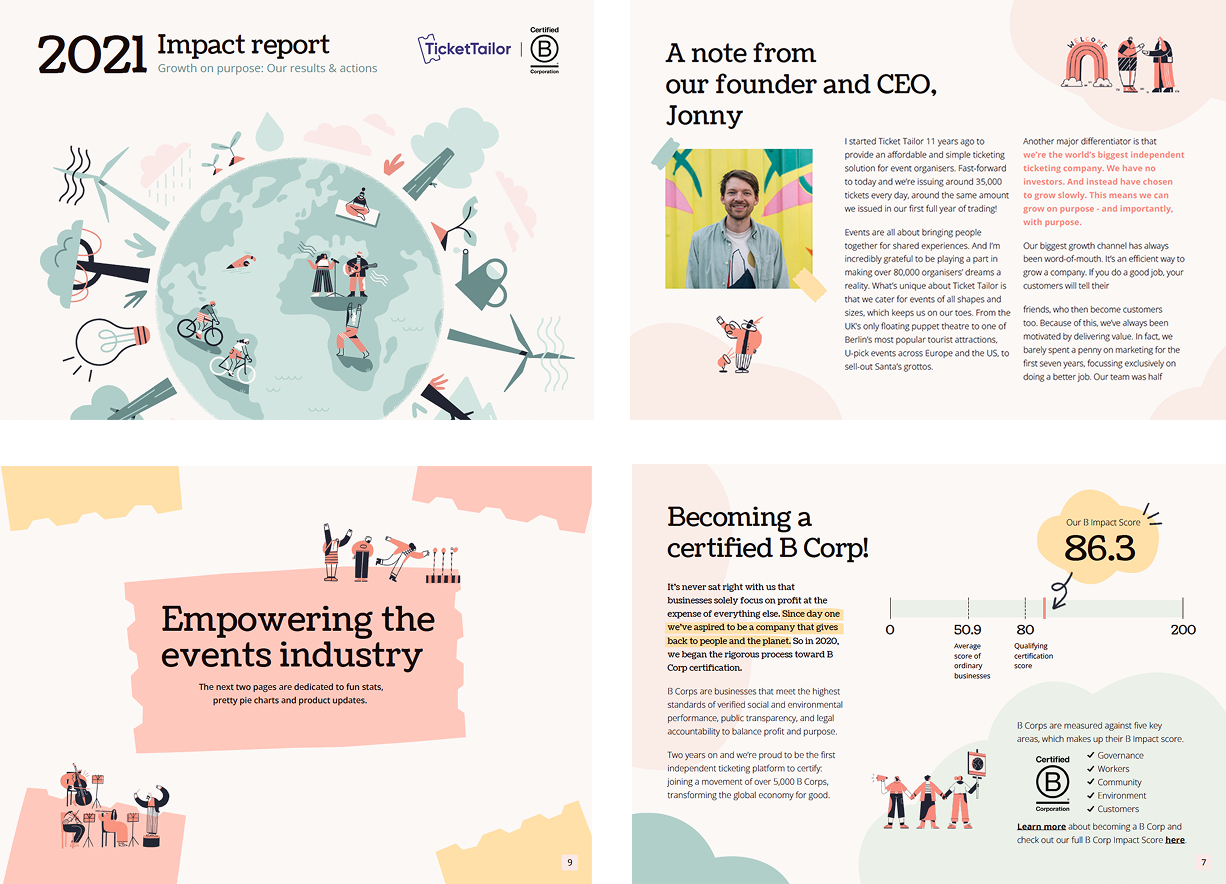
Ticket Tailor wanted to draw attention to their first Impact Report so we used their playful visual identity and designed a report and accompanying web page that captured the personality of the company whilst conveying the impressive work the team have done to stay true to their deserved B-Corp status.
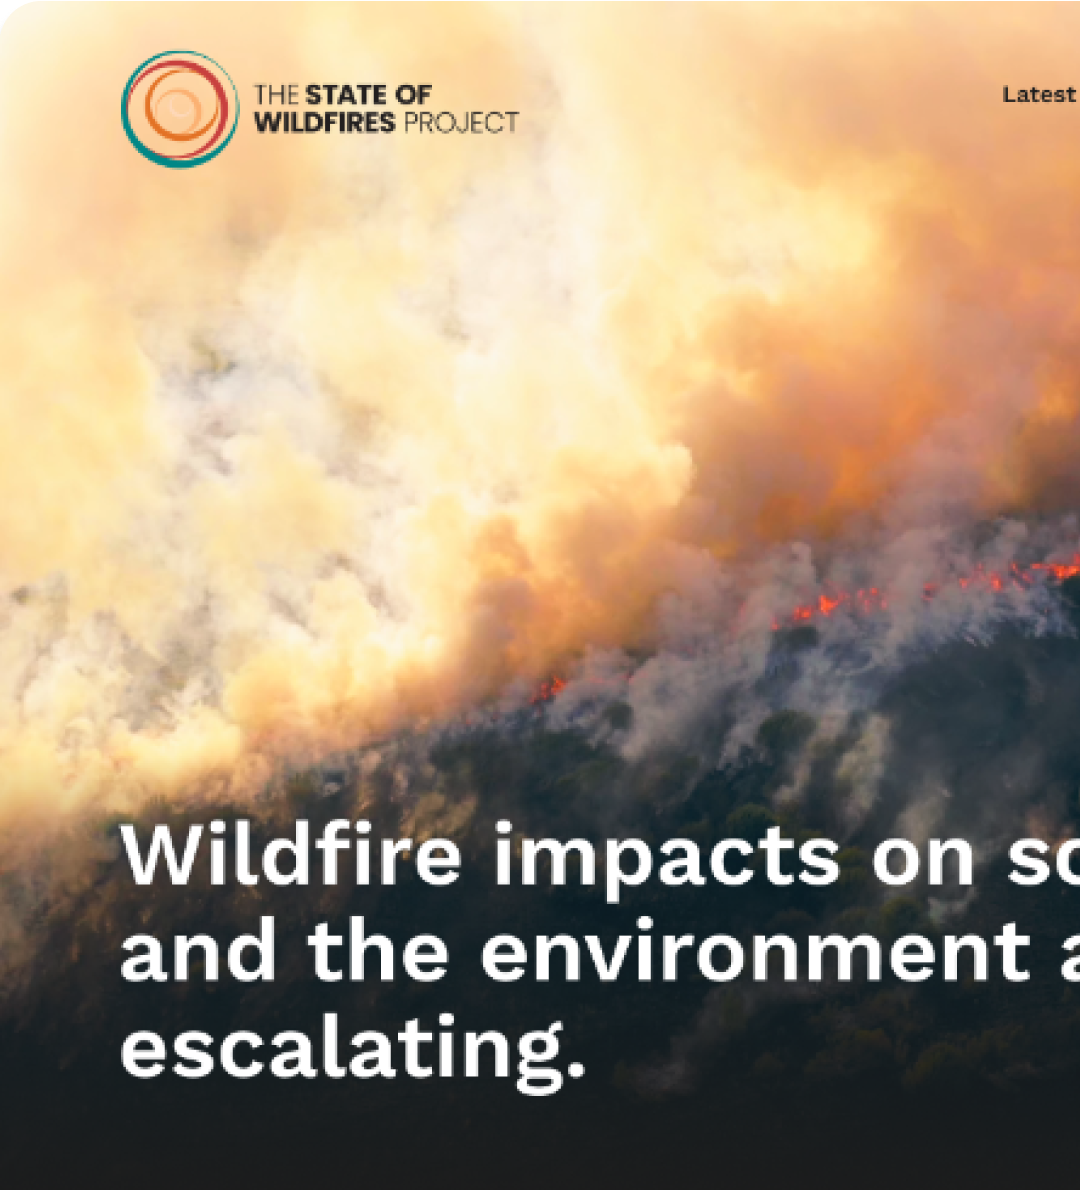
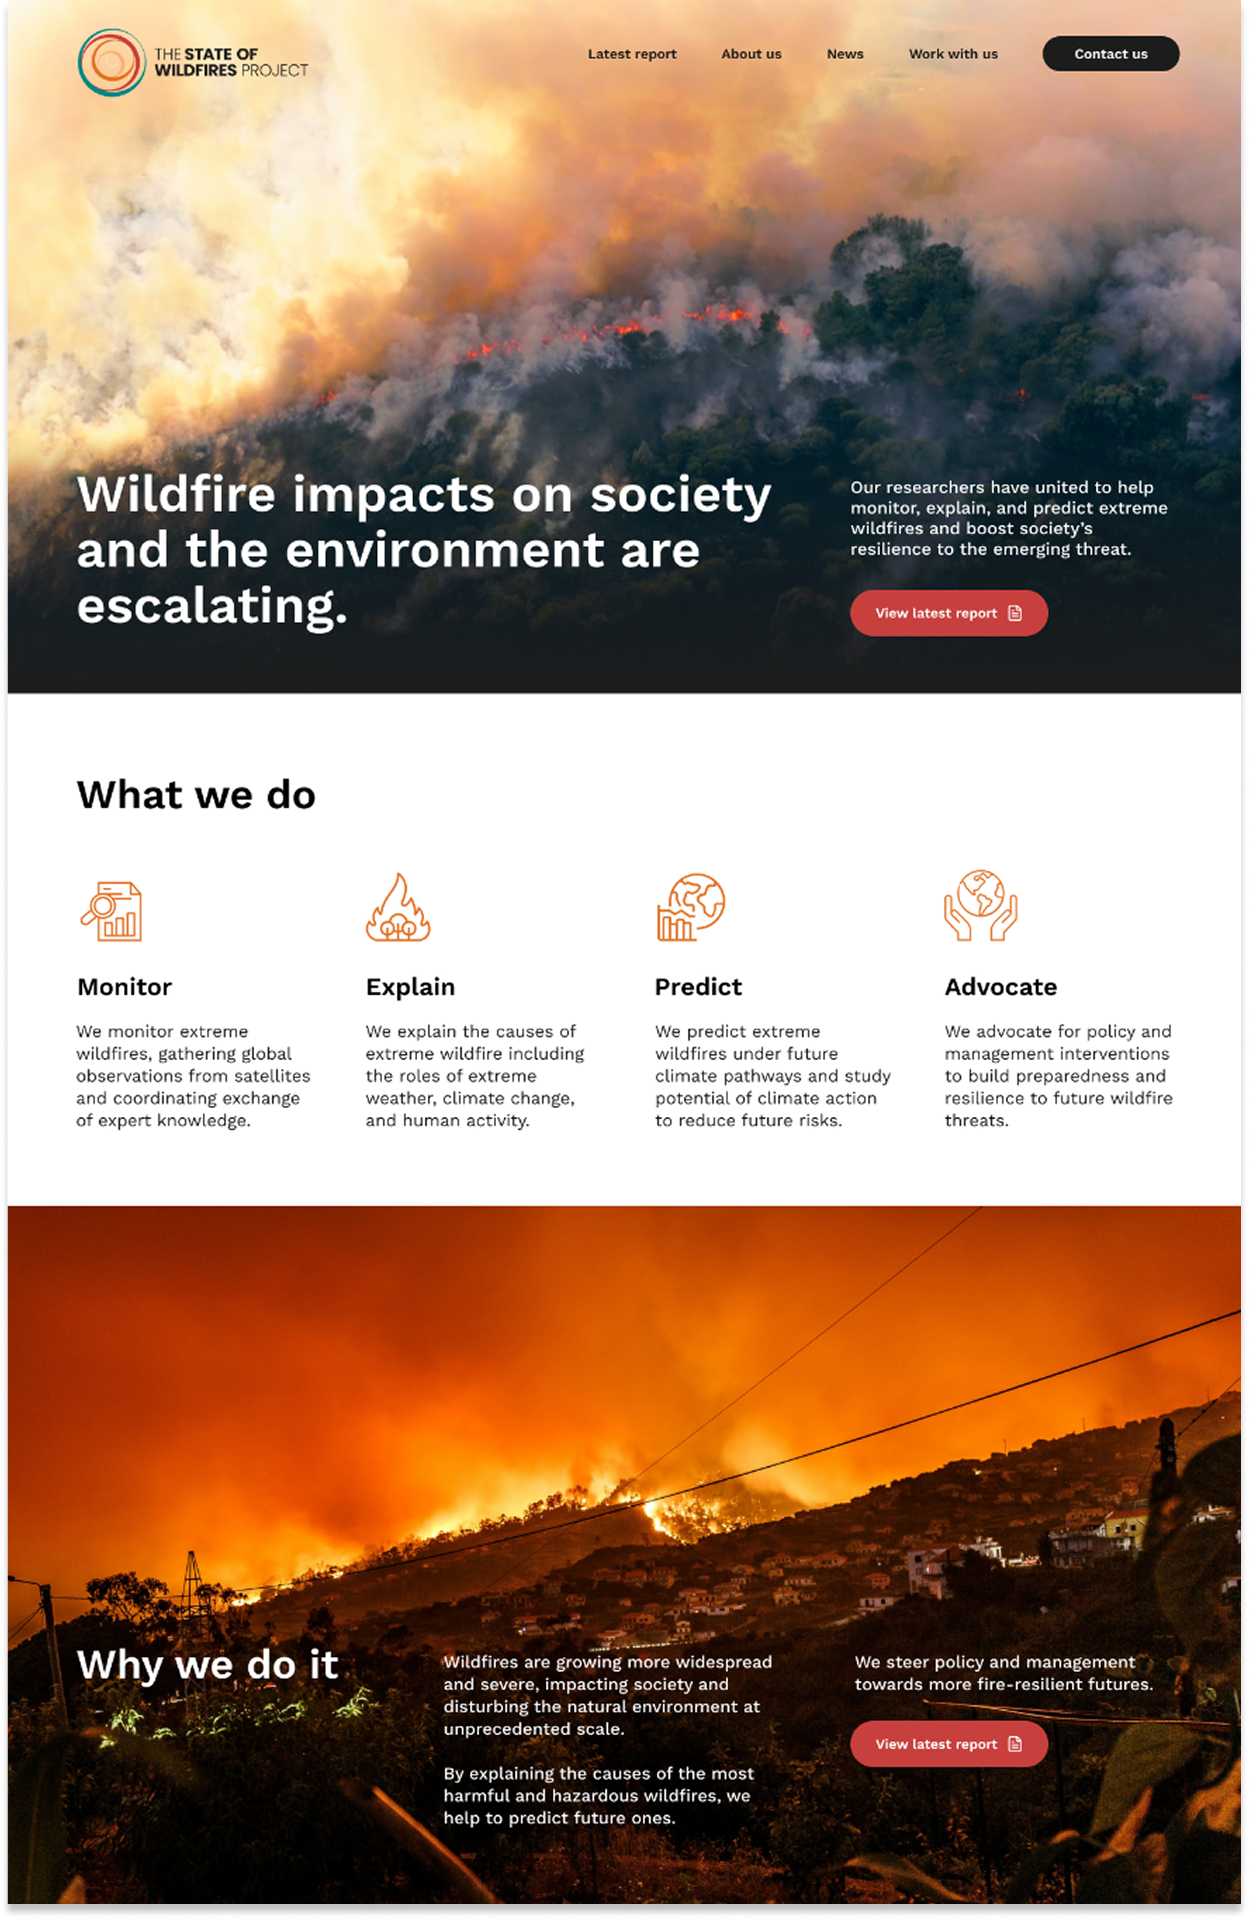
Leading wildfire research team State of Wildfires Project publish their annual report to a global audience and OPW designed their brand, website, report PDF plus immersive web version to maximise the impact and get valuable engagement with key stakeholders, policy makers and press around the world.

We translate complex research into accessible reports, visuals, and interactive pages that increase reach, and help secure collaboration, funding opportunities and subscription revenue.
We transform raw data into dynamic infographics, explainers, and immersive web content that adds depth, clarity, and reader engagement to fast-moving stories as well as long-form pieces.
We design strategic reports, branded visuals, and dynamic web pages that communicate your values, connect with stakeholders, and that resonates deeper with customers and investors.
We work with a network of specialist content writers, designers, illustrators and developers with a shared goal of creating impactful communications that will make a lasting difference to your organisation.

Founder / Design
Maria has worked with science, non-profit and enterprise organisations her whole career designing stunning brands, reports, infographics and immersive web pages.
Also founder of Magrox Design

Founder / Development
Sanjay started his career at Nature before working in a range of sectors designing and building high impact marketing websites and digital products for companies worldwide.
Also founder of Vector

Content design is the process of shaping information so it’s clear, engaging, and easy to consume. Instead of focusing only on how something looks, content design looks at structure, flow, messaging and well thought out visuals to help people understand often complex information.
We work mainly with science organisations, charities, non-profits, publishers, and impact-driven businesses such as B-Corps. Our service is best suited to teams producing research, reports, or long-form content that needs to be more engaging, accessible, and effective.
Yes, we're happy to work with your existing Wordpress website and either create new sections or pages within the CMS or provide stand alone code that your own development team can integrate.
Yes. We specialise in transforming long, often complex and/or technical reports into engaging web pages and well-designed PDFs. This includes documents such as impact or annual reports, policy documents, and thought leadership content.
Absolutely. We regularly work with scientific, technical, and data-heavy material. Our approach focuses on clarity and storytelling, without oversimplifying or losing accuracy.
A standard PDF is usually linear and text-heavy. An interactive report is designed for digital reading, using layout, visuals, navigation, and (where appropriate) interactivity to guide readers and keep them engaged.
Clear, engaging content keeps people reading for longer, improves understanding, and builds trust. For publishers and organisations, this can lead to higher engagement, more downloads, increased subscriptions, and better performance from existing content.
Yes. We design both web-based reports and downloadable PDFs, and often create them together so they work as part of the same communication piece.
We typically need your existing content (draft or final), your goals for the project, and any brand guidelines. We’ll guide you through the rest of the process and help shape the content with you if needed.
Yes. We can create new content directly on your existing website, whether it’s WordPress or another platform, and make sure it fits seamlessly with your current design, style and to your specific technical requirements.